ChartHop Goals connects company priorities to live people and business data so leaders get instant visibility into progress, dependencies, and execution risk. Because goals are connected to the data that actually runs the business, Ask ChartHop can answer complex questions instantly using real organizational context.
Most organizations set goals in one place, track progress somewhere else, and explain results in a third. By the time leaders get visibility, it's too late to course-correct.
ChartHop Goals is built directly on your org structure and connected to live business data from systems like Salesforce and Zendesk so progress updates itself. Combined with Performance, Compensation, and Headcount Planning, goals become the connective tissue between strategy, people, and outcomes.
It's goal tracking that finally keeps up with the business.
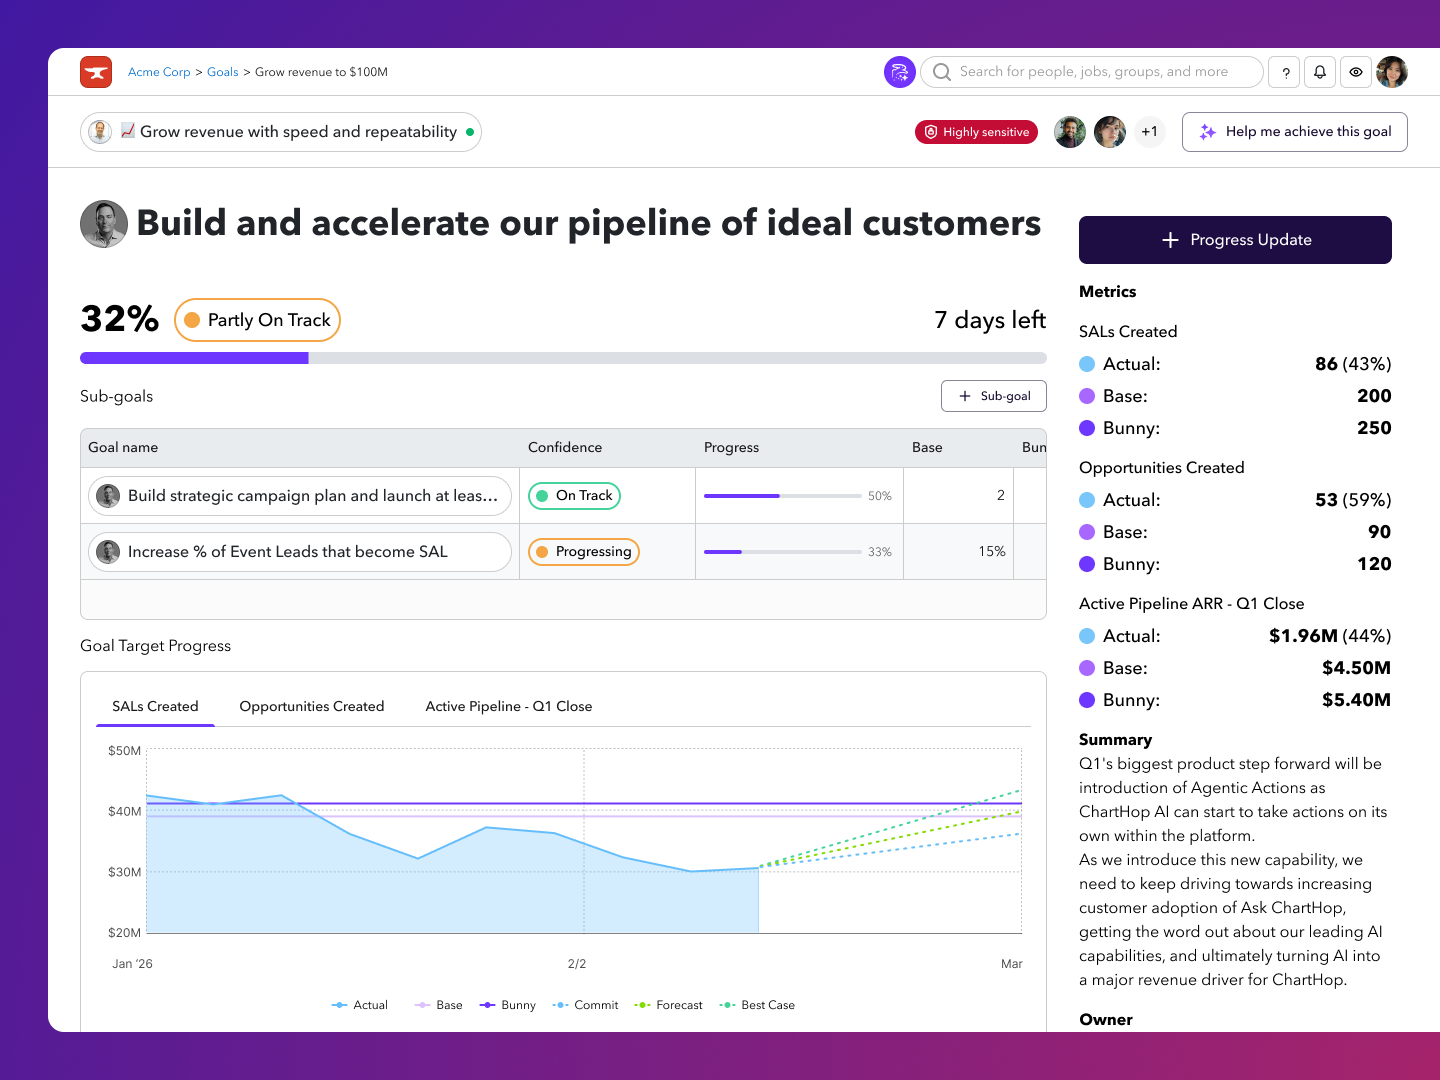
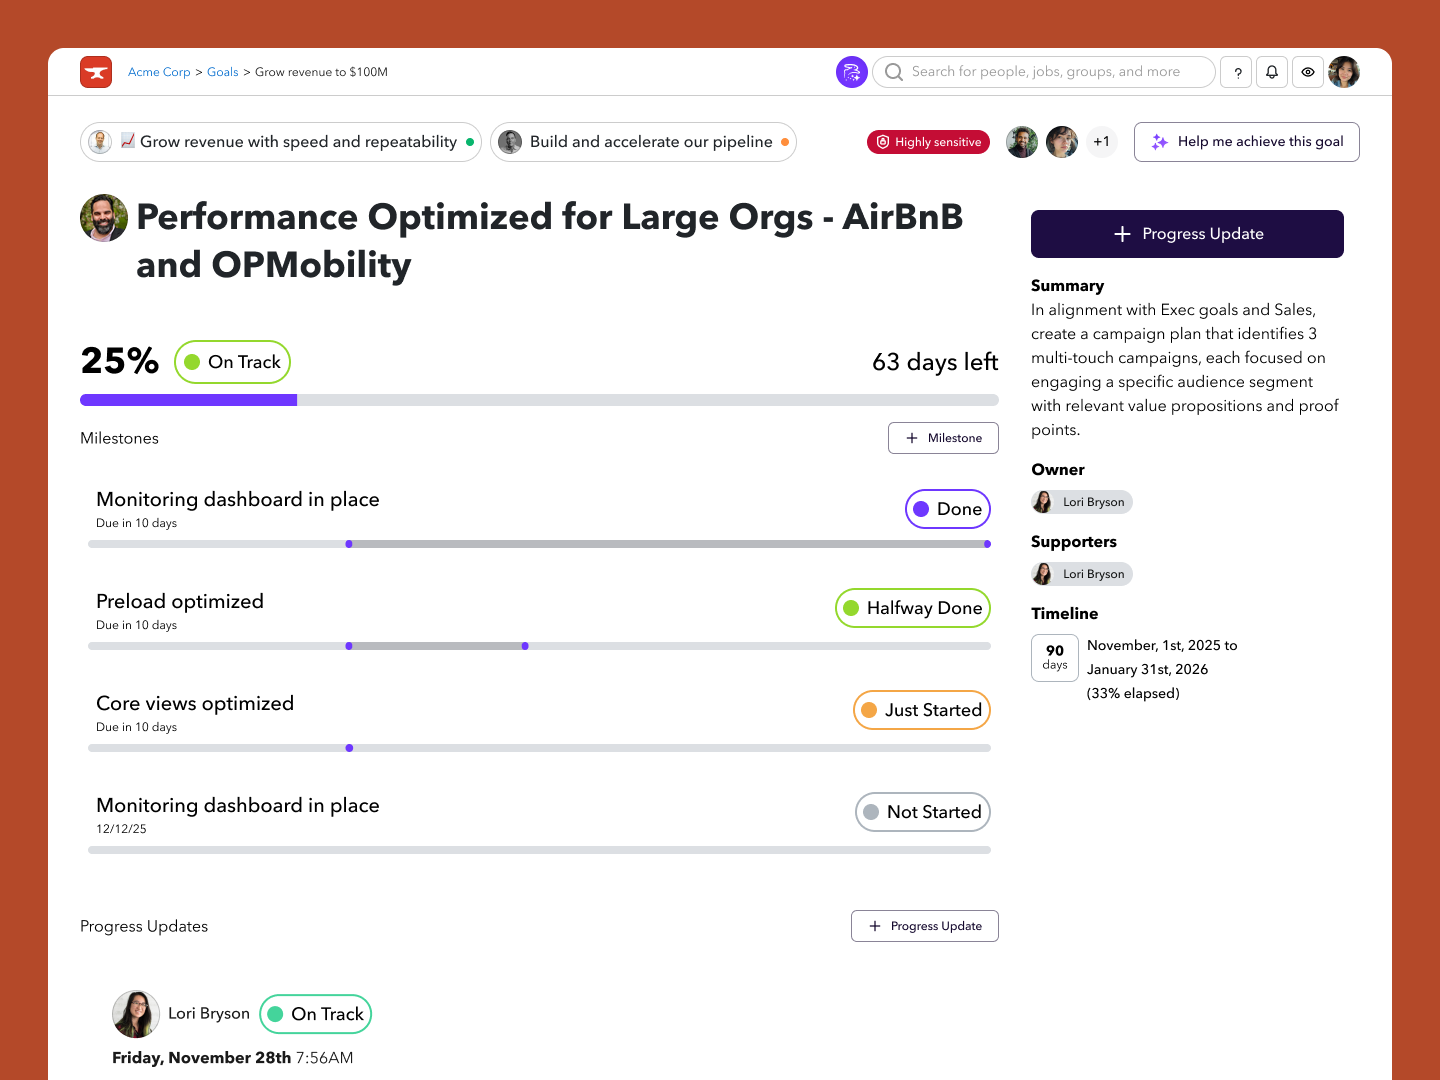
Set company-level priorities and cascade them down through departments, teams, and individuals. Every goal maps to the org chart, so leaders can see alignment at a glance.
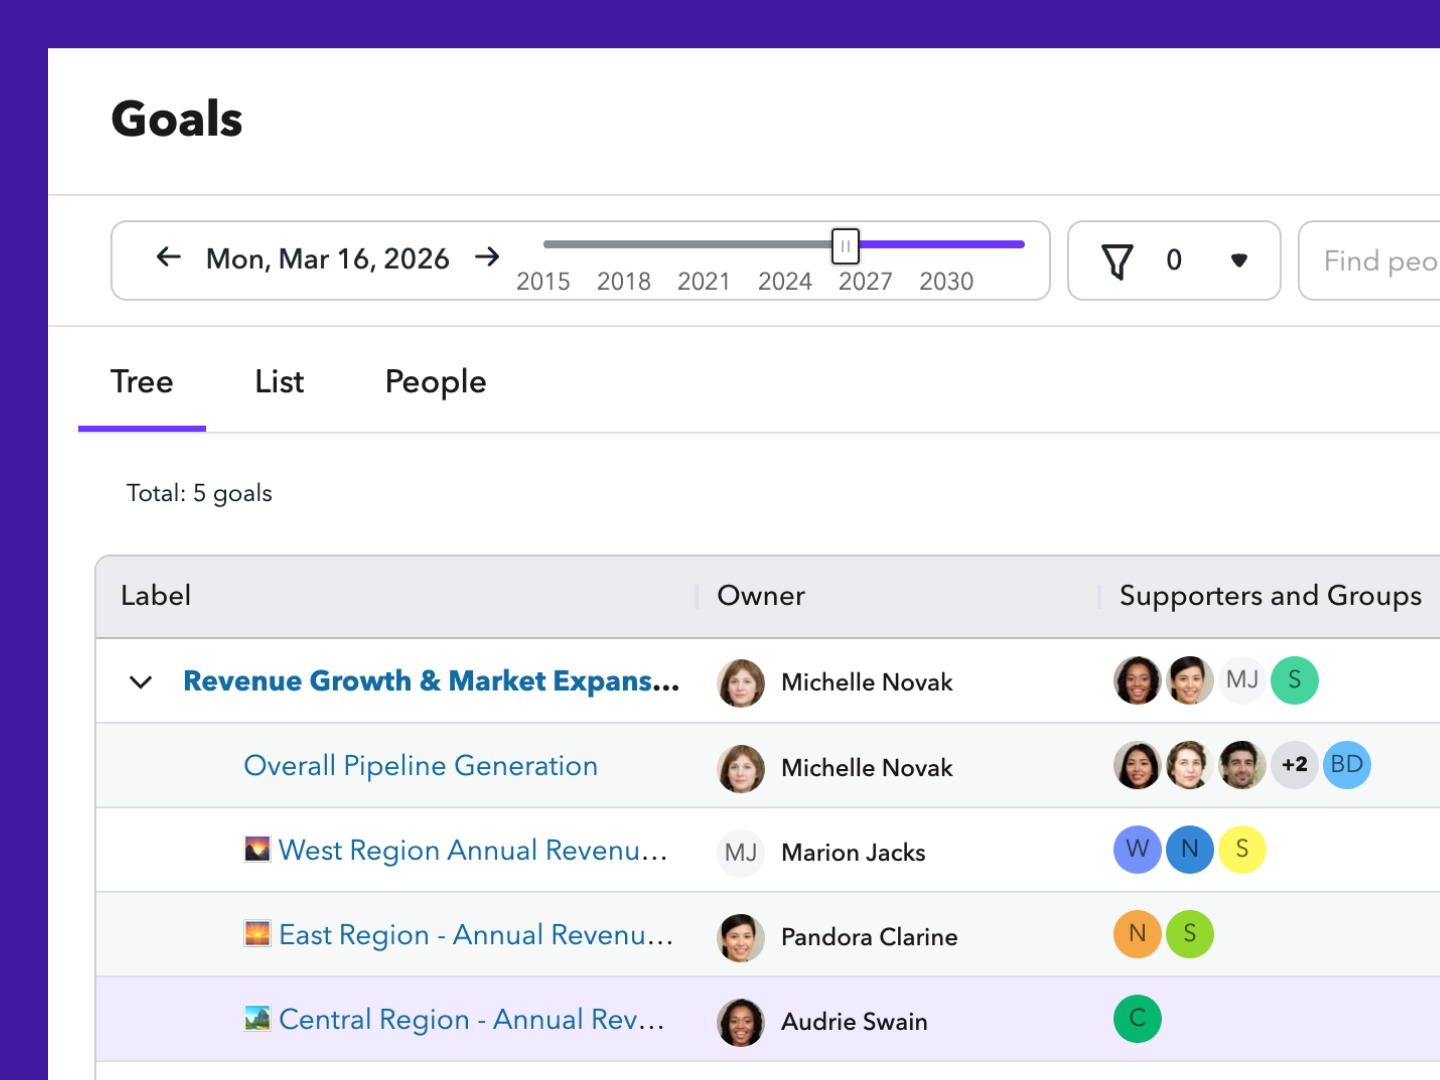
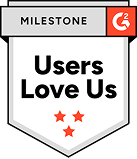
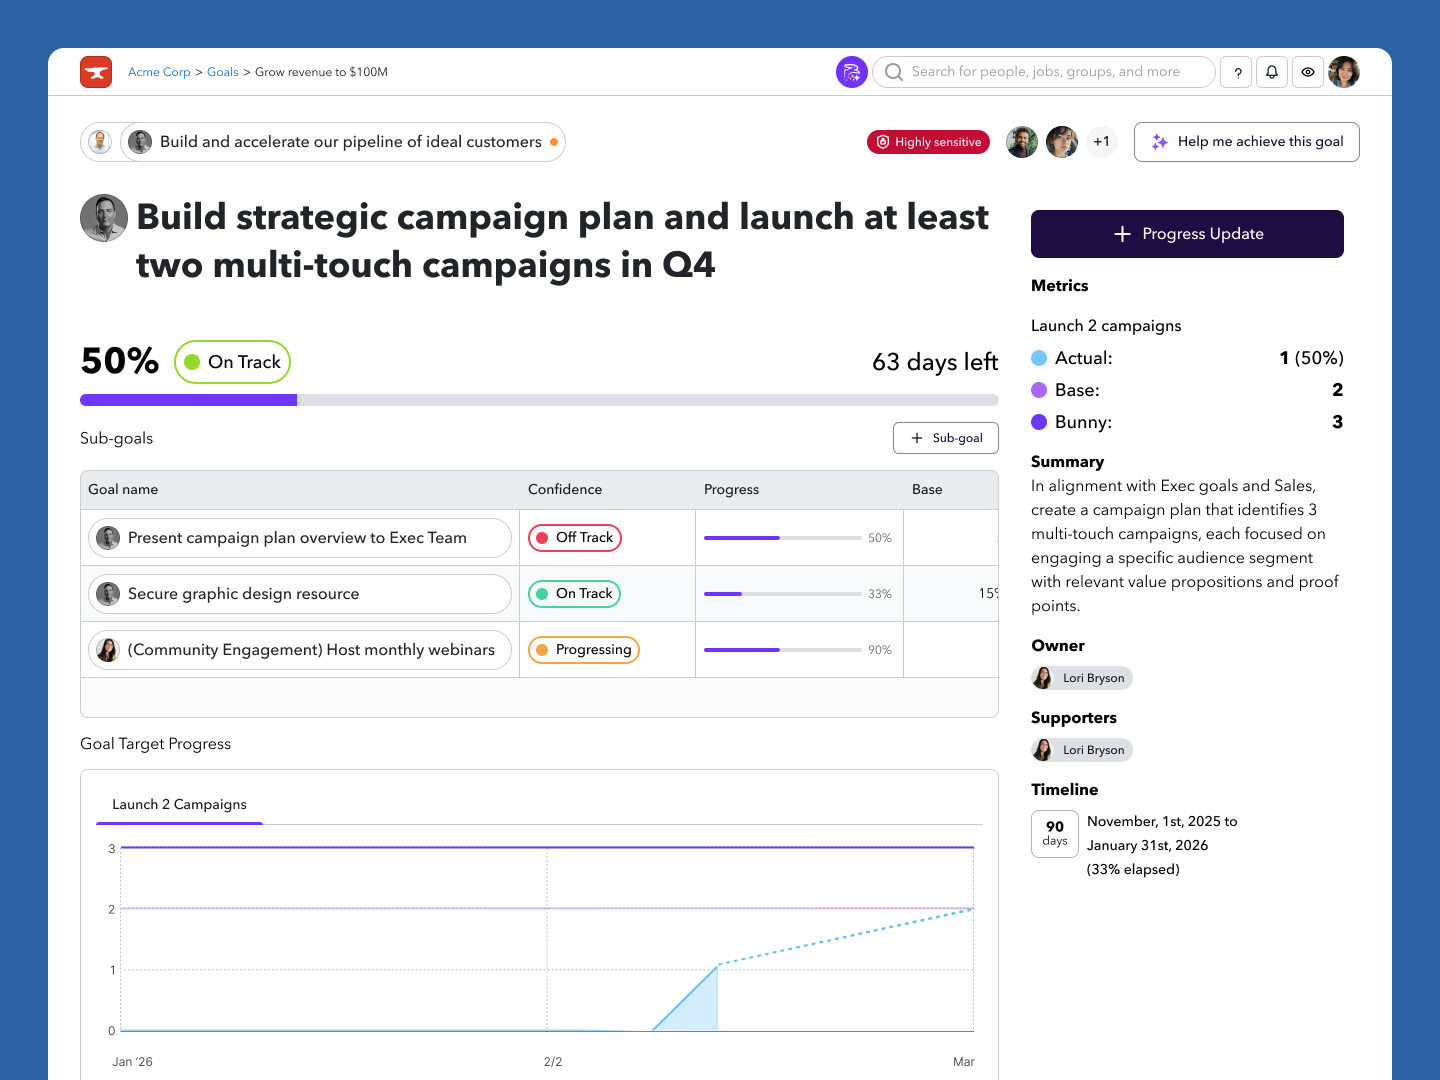
Pull metrics directly from Salesforce, Zendesk, and other business systems into goal progress tracking. When the underlying data changes, goals update automatically. No exports, no copy-pasting, no "let me check on that."
Every goal preserves its history, including status changes, dependencies, decisions, and outcomes over time. When someone asks "what happened with Q2?" the answer is already there, not buried in someone's inbox.
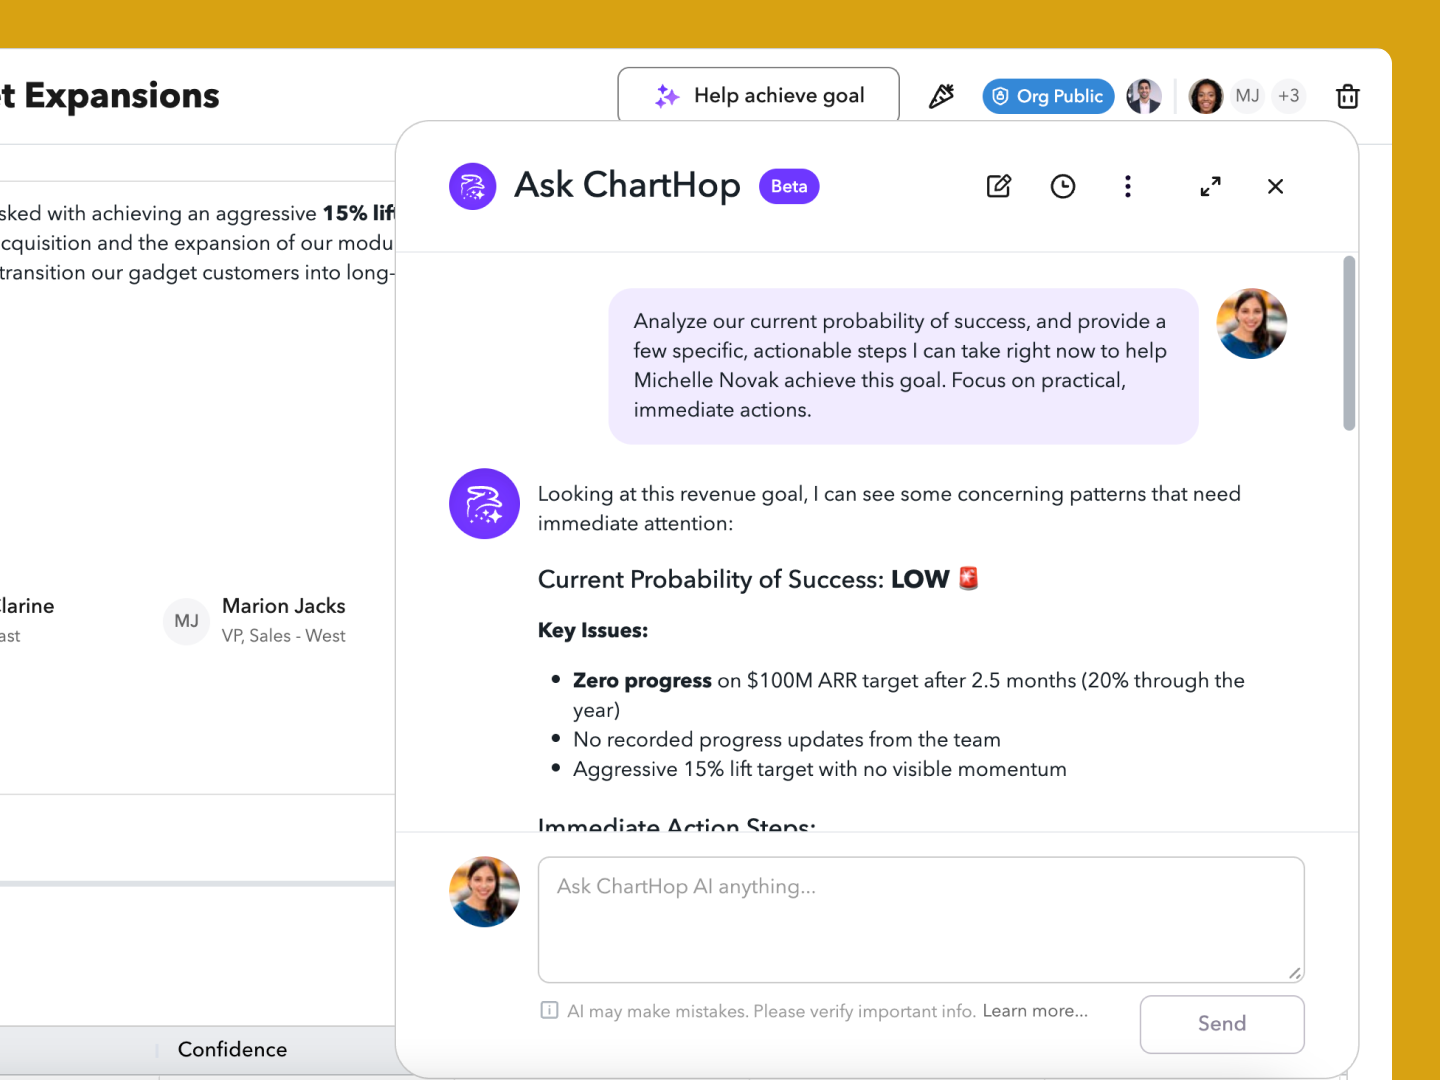
Because goals are structured, contextual data inside ChartHop, Ask ChartHop can reason about progress, flag risks, and answer questions like "Which teams are behind on Q3 targets?" or "What goals depend on the engineering reorg?" in plain language.
Not every goal belongs to a single person. ChartHop Goals supports individual, team, department, and shared ownership models so the way goals are structured matches the way work actually gets done.
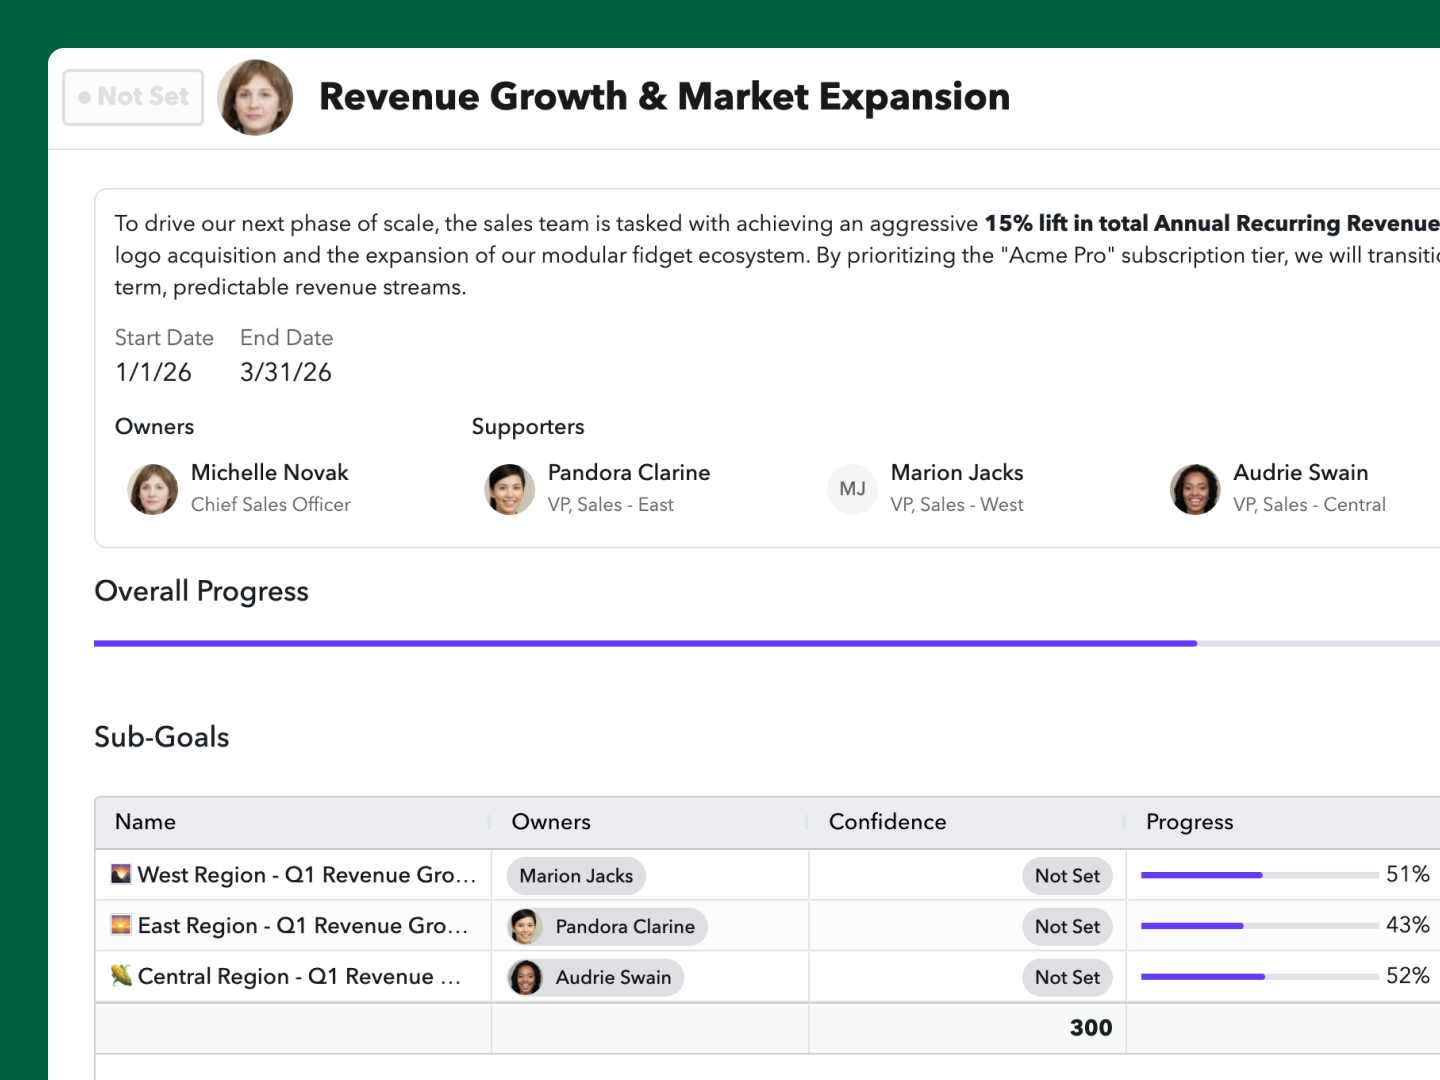
Visualize goals across dashboards and org charts. See progress by team, department, or the whole company. Give executives the big picture and give managers the details they need, all from the same data.


One unified platform for everyone in your organization.

All the information you need to set your team up for success

Connect your people data and your people ops

Teach your employees to fish — for answers to their people data questions

Eliminate headcount headaches to spend your time where it matters

Behold, a platform that actually boosts efficiency

Empower your org through insights, alignment, and action

Use better people data to get your team where they need to be

Discover how ChartHop helped 1Password streamline processes and secure their comp planning to better protect their employees’ sensitive data.

Discover how Zip automated compensation cycles, improved visibility and collaboration, and brought context to compensation decisions with ChartHop.

Discover how YipitData streamlined collaboration between People, Recruiting, and FP&A teams with ChartHop.

Discover how Truework consolidated their people data to save time, increase transparency, and improve processes with ChartHop.

Discover how ChartHop helped Rémy Cointreau save time on manual org chart updates, empower HR and team leaders to proactively plan for workforce changes, and introduce a more intentional hiring plan.

Discover how ChartHop helped Wista consolidate their headcount planning, align with Finance, and eliminate manual tasks—all in one place.

Discover how one fintech company moved their org planning process out of spreadsheets and into ChartHop's secure, intuitive, and visual platform.

Discover how ChartHop helped Hebba streamline the HR tech stack to get the most out of people data in an easy way and deliver actionable insights for better business decisions.

Discover how Movable Ink brought people data together in a source of truth, streamlined performance reviews, and improved HR tech adoption with ChartHop.

Discover how ChartHop helped a post-Series A startup clearly communicate their vision for growth, be transparent with employees, and identify new opportunities to grow the business.

Discover how ChartHop helped InVision boost productivity and improve insight into the global workforce with an automatically updated org chart, self-serve access to employee data, and integrated HR systems.
Discover how Altruist made more fair and equitable compensation decisions, empowered managers to participate in the comp review process, and easily controlled access to sensitive data with ChartHop.
Yes. ChartHop Goals supports individual, team, department, and shared ownership. This is especially useful for cross-functional initiatives where multiple people or groups contribute to a single outcome.
Because goals in ChartHop are structured data with organizational context, Ask ChartHop can answer natural language questions about goal progress, dependencies, and risk. For example, you could ask "Which departments are behind on their Q3 goals?" and get an instant, accurate answer.
ChartHop Goals works best for growing organizations where teams need to stay aligned and leaders need to know what's on track without asking. Whether you're running a 200-person company or a 5,000-person enterprise, Goals gives every level of the organization – from executives to team leads – a shared, real-time view of what matters most.
Yes. ChartHop Goals preserves the full history of every goal, including status changes, ownership, dependencies, and decisions. This gives leaders the context they need to understand not just what happened, but why.
Standalone OKR tools require someone to manually update progress, live in their own silo, and tell you very little about why something is off track. ChartHop Goals is built on your org structure and pulls live data from the systems your teams already use, so progress stays current on its own. And because goals sit alongside your people data, performance reviews, and headcount plans, you get the full picture – not just a status color.
Most OKR tools are standalone systems where someone has to manually update progress. ChartHop Goals is built on your org structure and connected to live business data, so progress tracks itself. You're not maintaining another tool, you're getting a real-time view of execution that reflects what's actually happening in the business.
Two things make adoption easier with ChartHop Goals. First, live data connections mean people aren't asked to manually update progress every week, which is the biggest reason goal tools get abandoned. Second, Ask ChartHop makes goals useful for everyone, not just the People team. Any leader can ask a plain language question about goal progress and get an instant answer, which means they actually have a reason to use the tool.
ChartHop Goals integrates with the business systems your teams already use, including Salesforce and Zendesk. These integrations pull live metrics directly into goal progress so tracking stays current without manual work.
Absolutely. Goals shares the same data layer as Performance, Compensation, Headcount Planning, and HRIS. That means goal attainment can inform performance reviews and compensation decisions, and headcount plans can connect to the strategic priorities they're meant to support.